 Work
big-sister
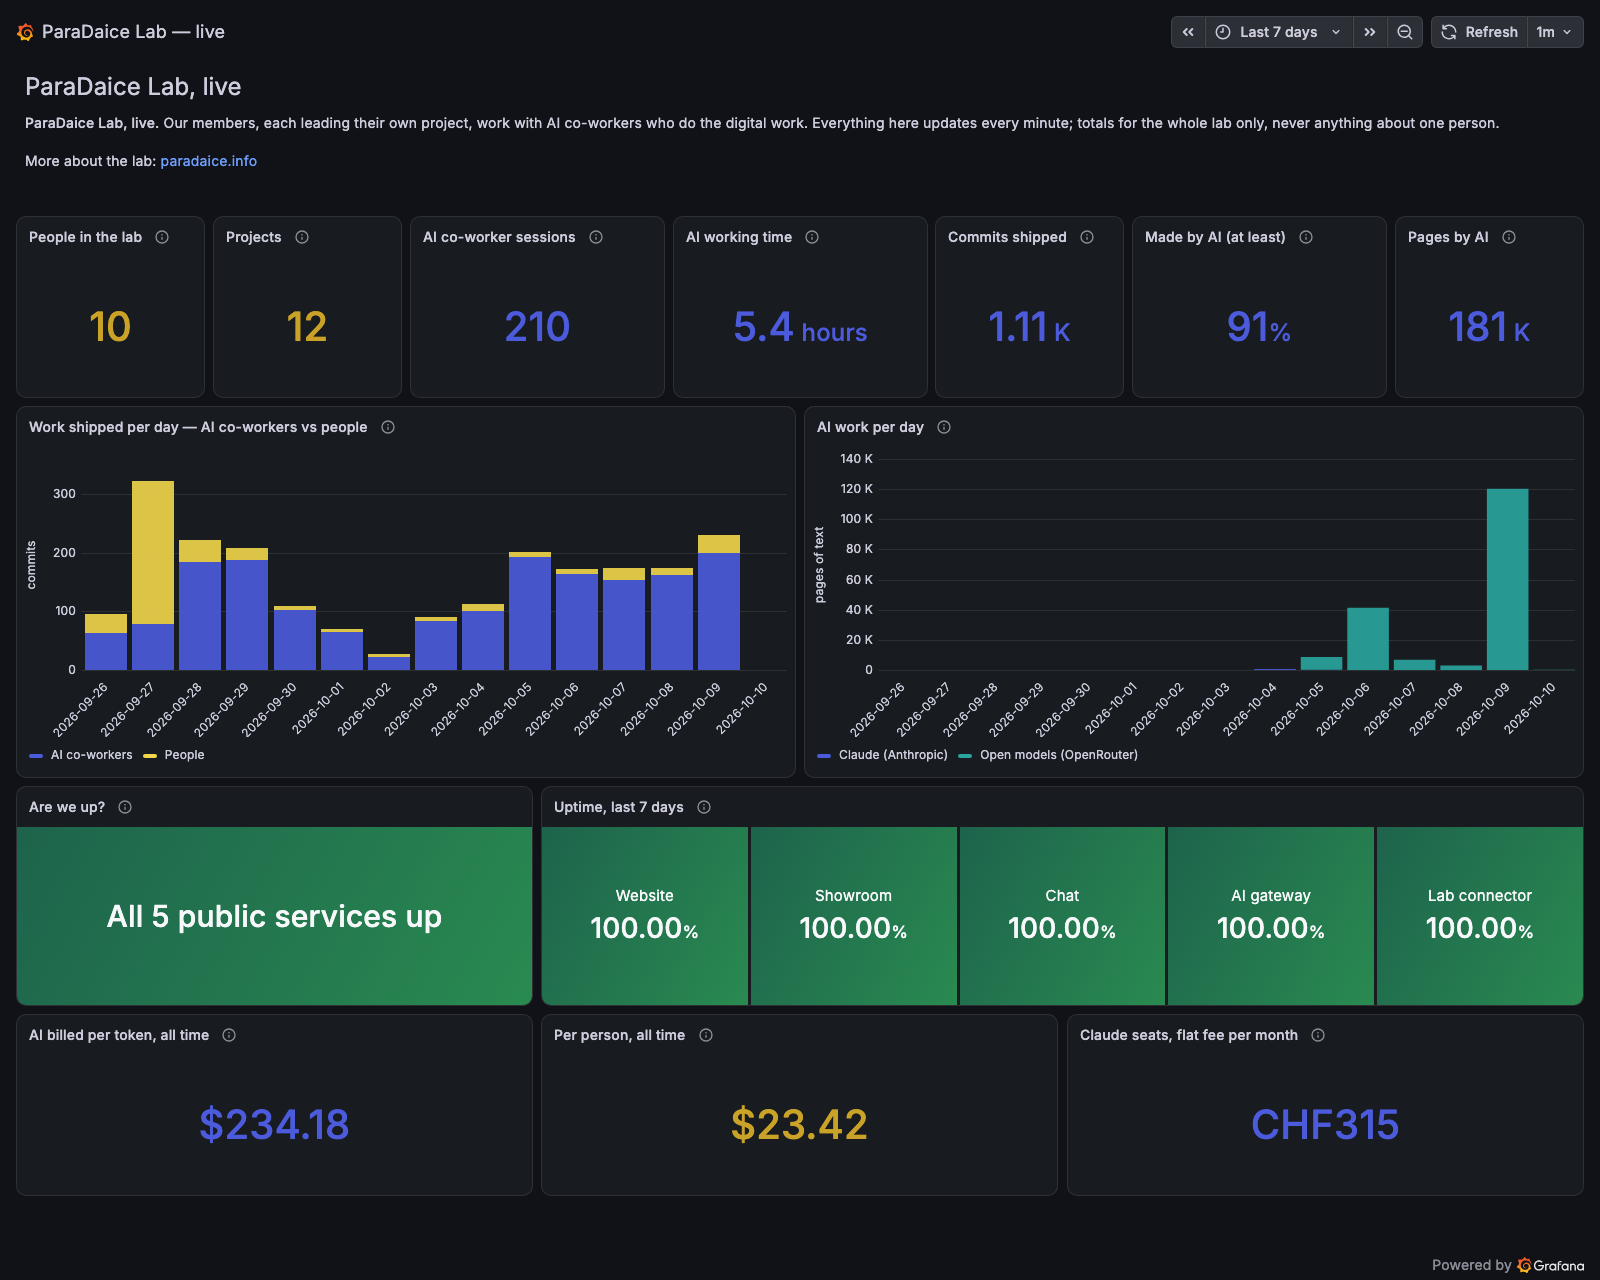
Watch a lab where agents do most of the work, live. In the week to 10 Oct 2026, they made at least 91% of about 1,100 code changes.
One public dashboard, updated every minute: who is here, what the agents shipped, what it costs, and whether every service is up. It shows totals for the whole lab only, never one person — and says "at least" because a change counts as AI work only when it carries the commit marker we began adding on 22 Sep 2026.
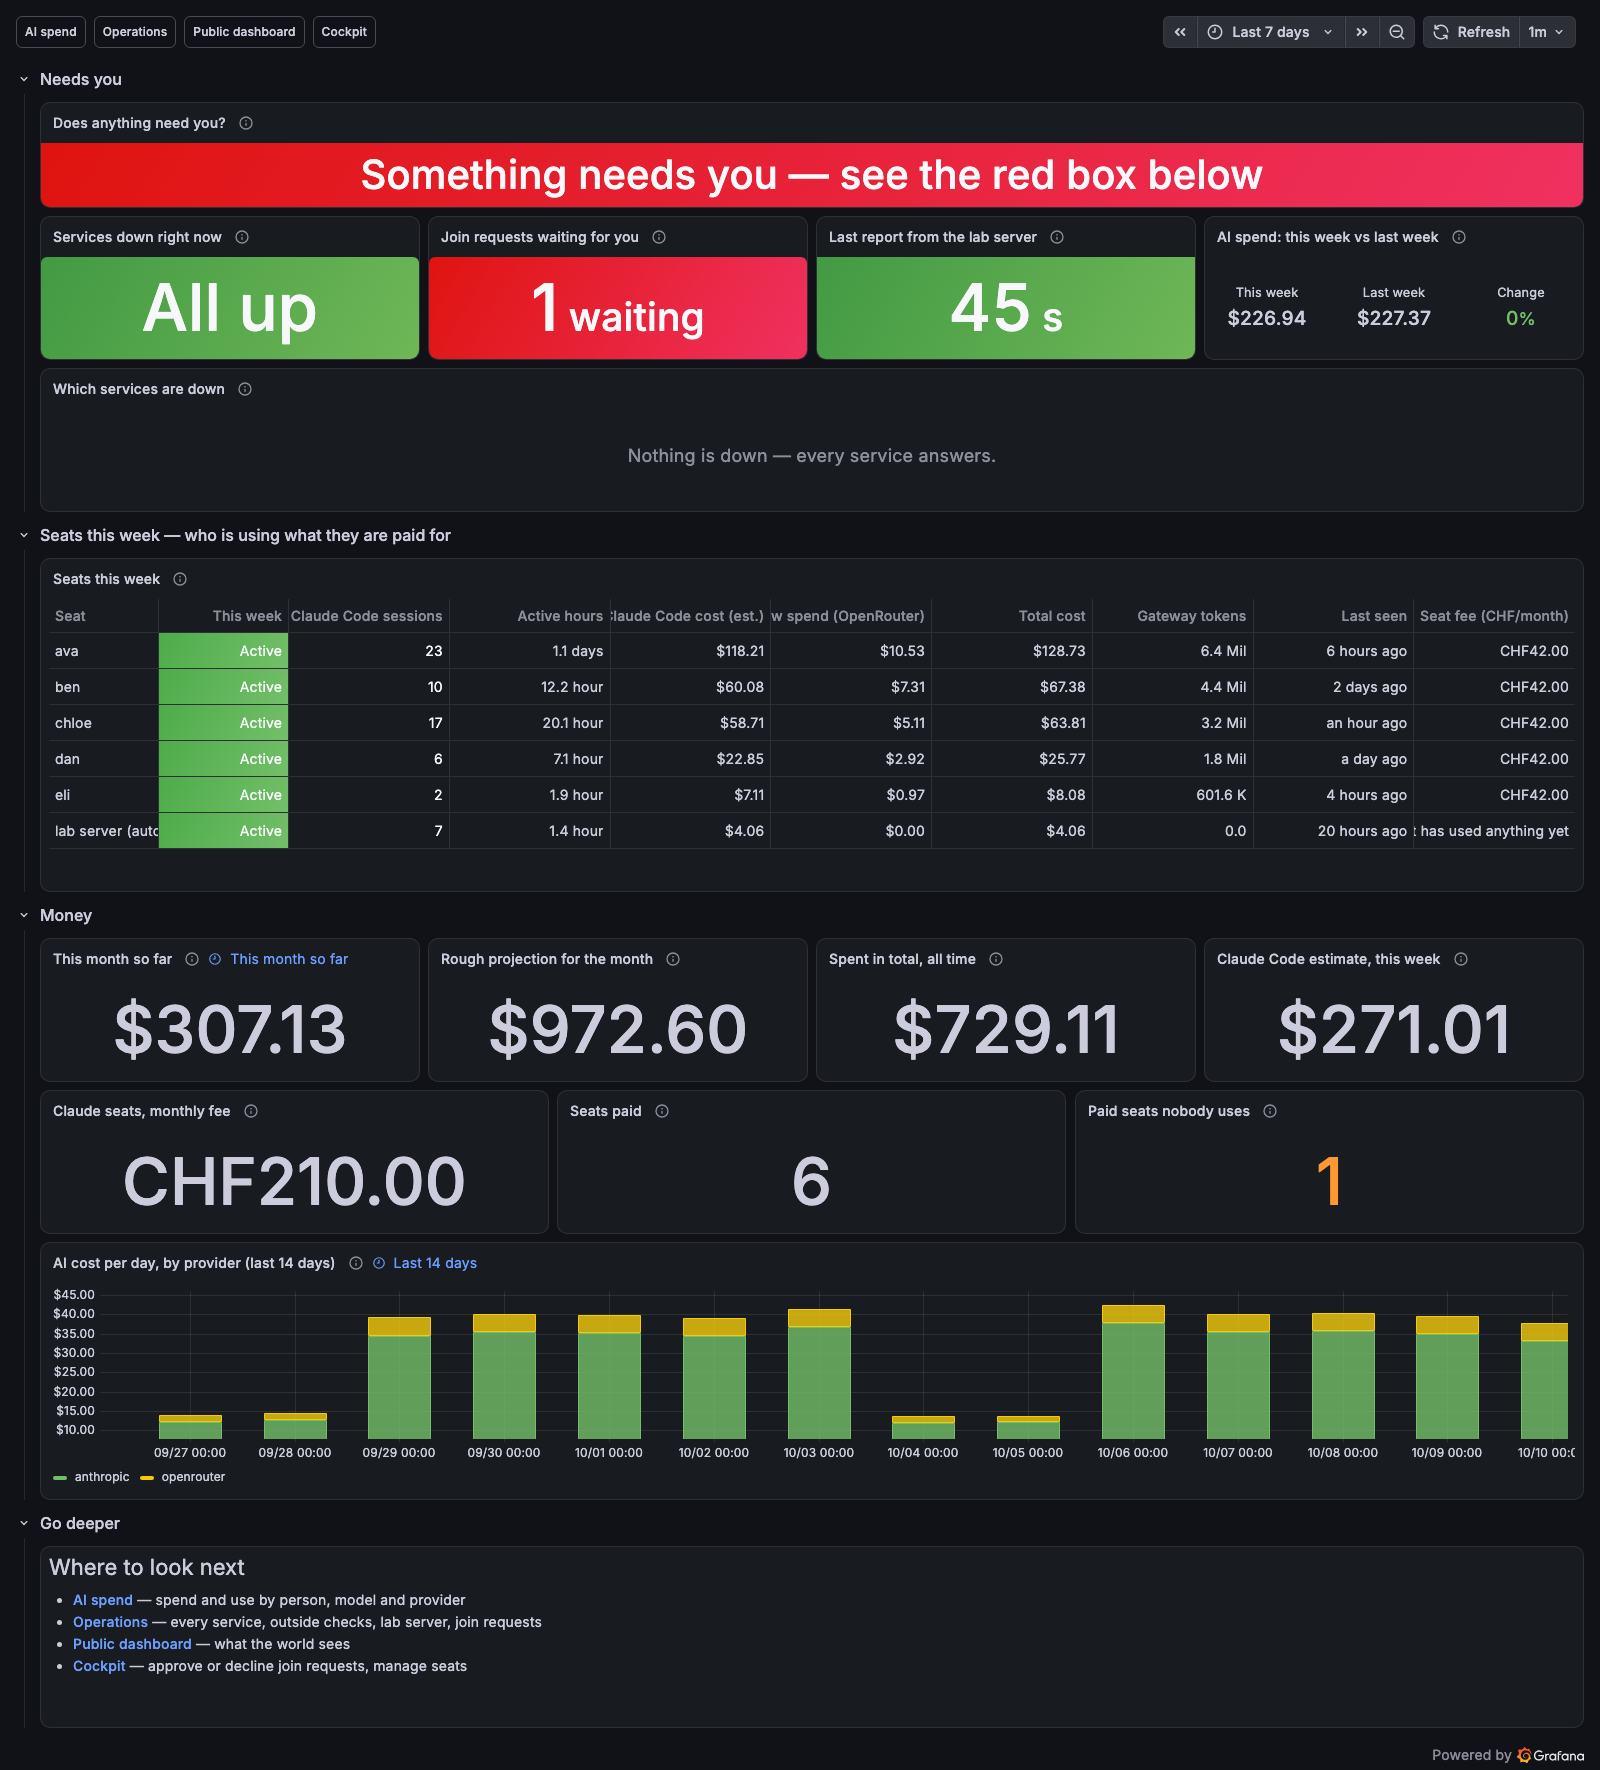
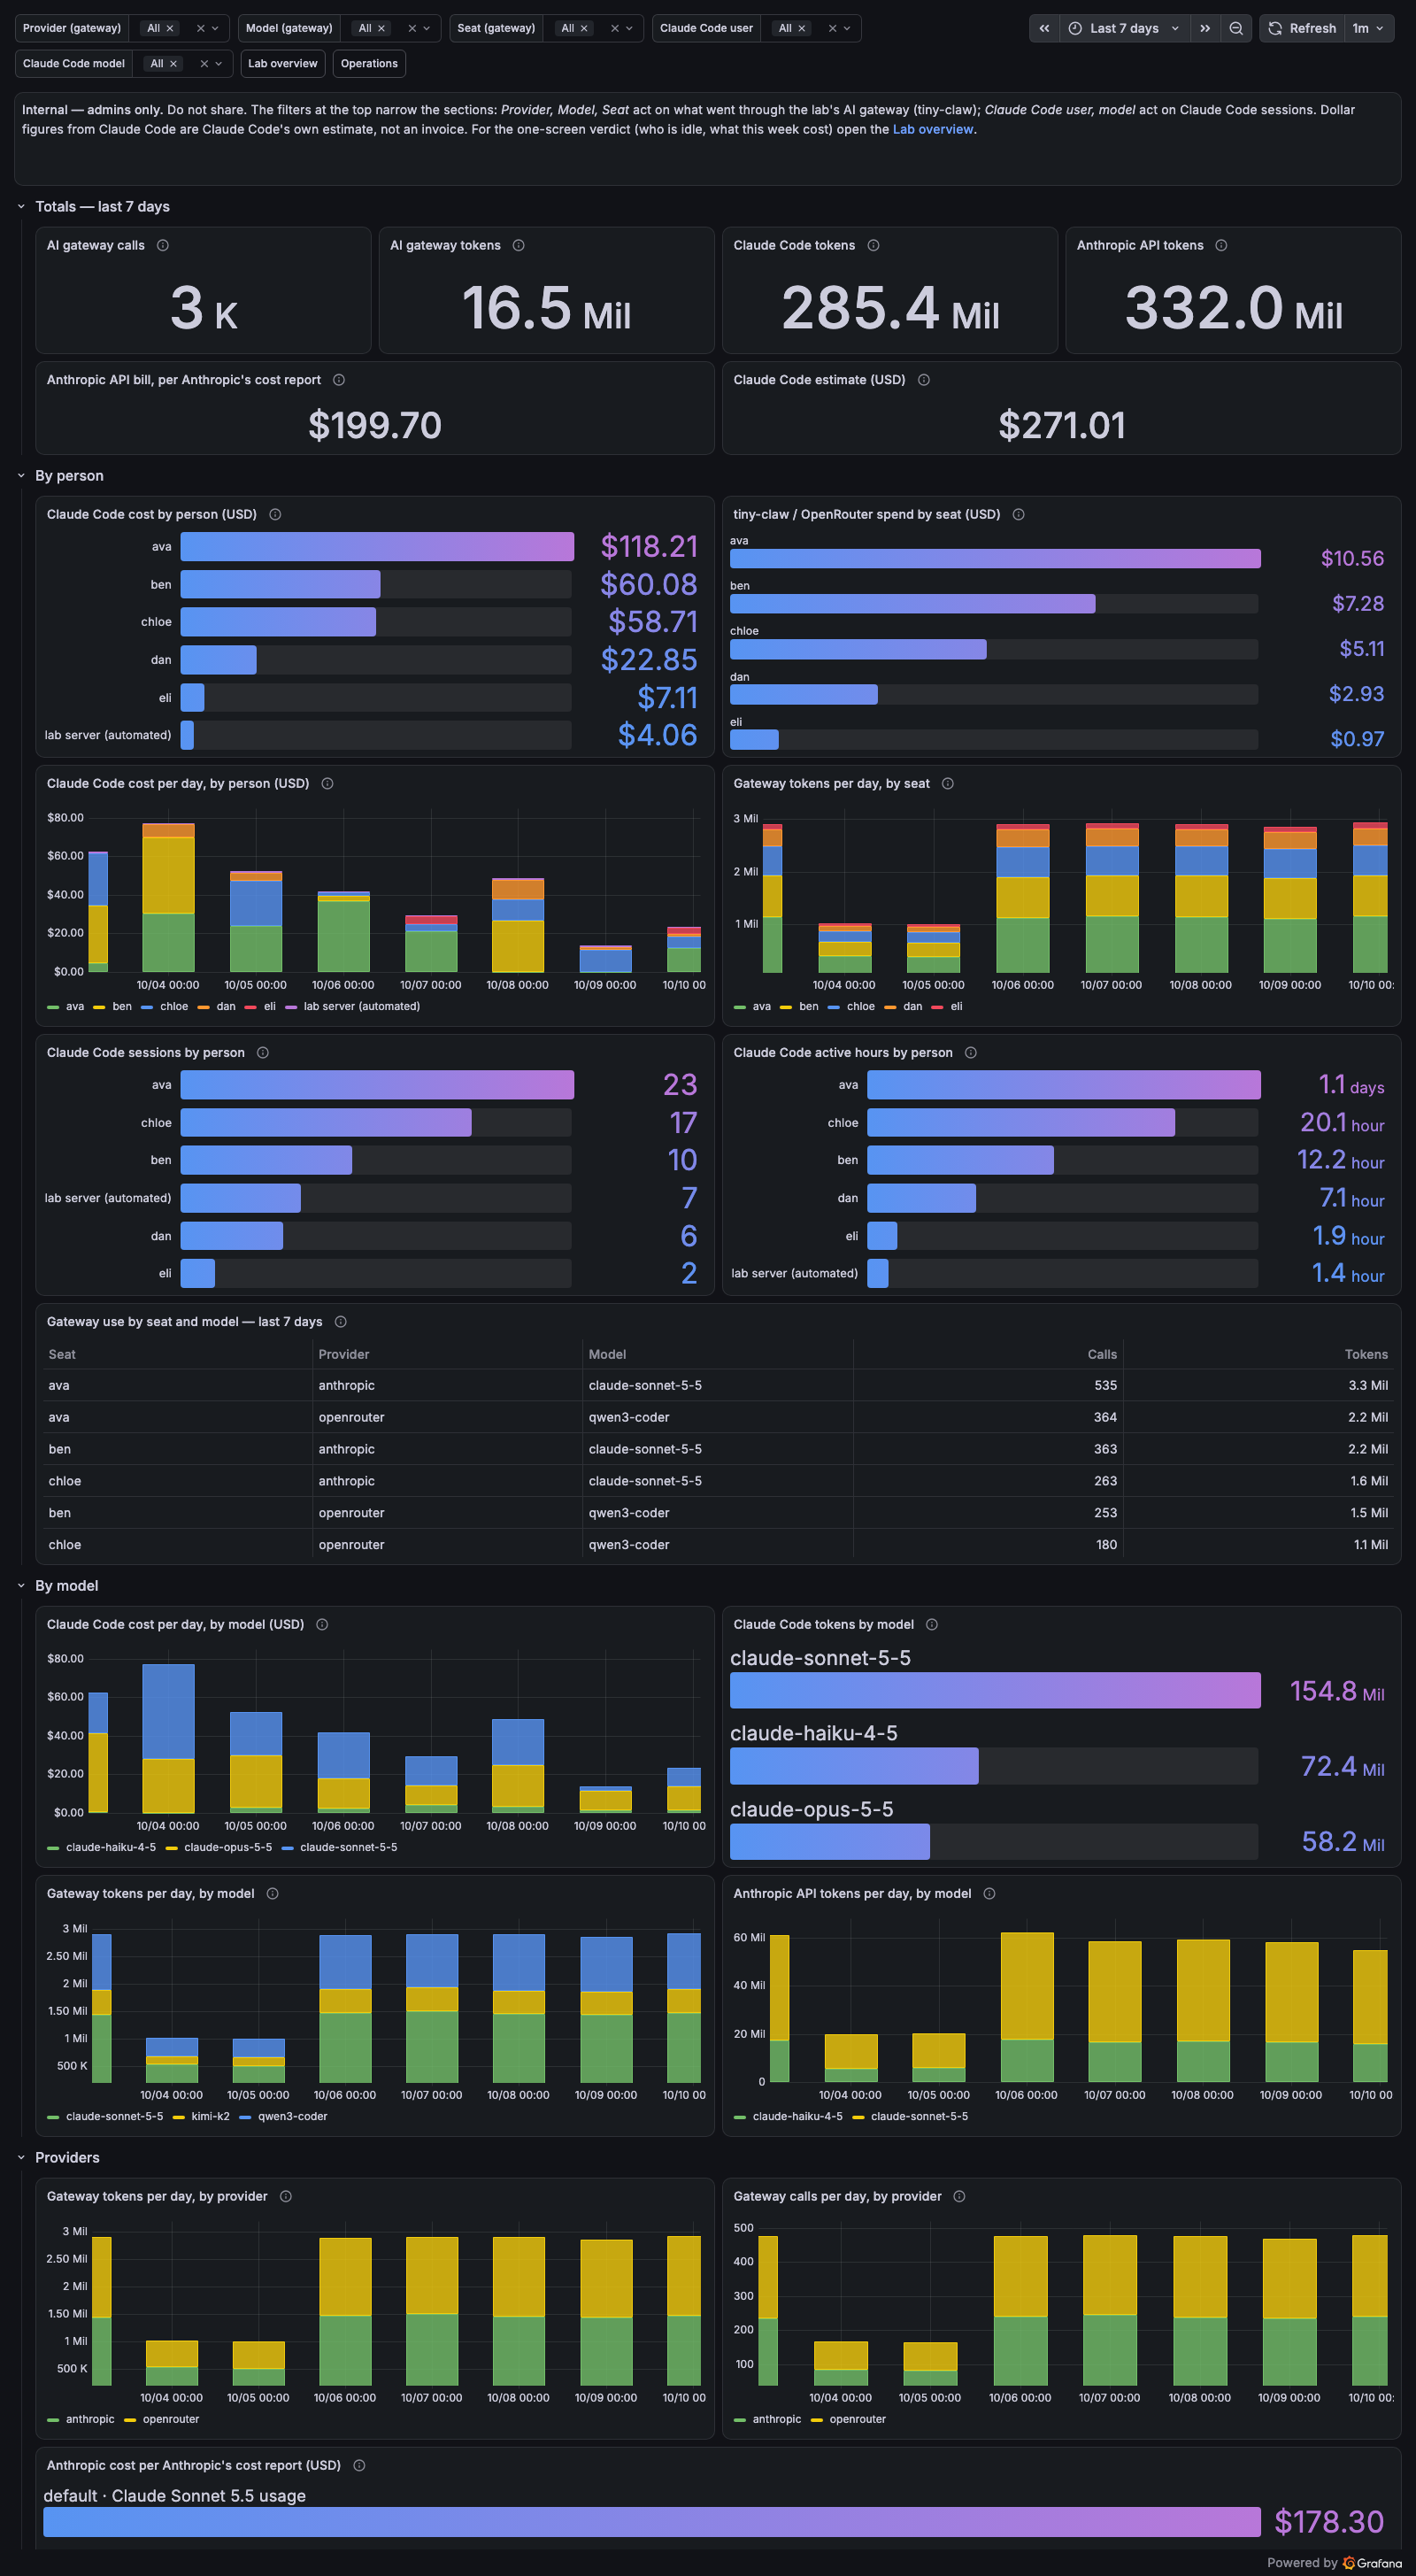
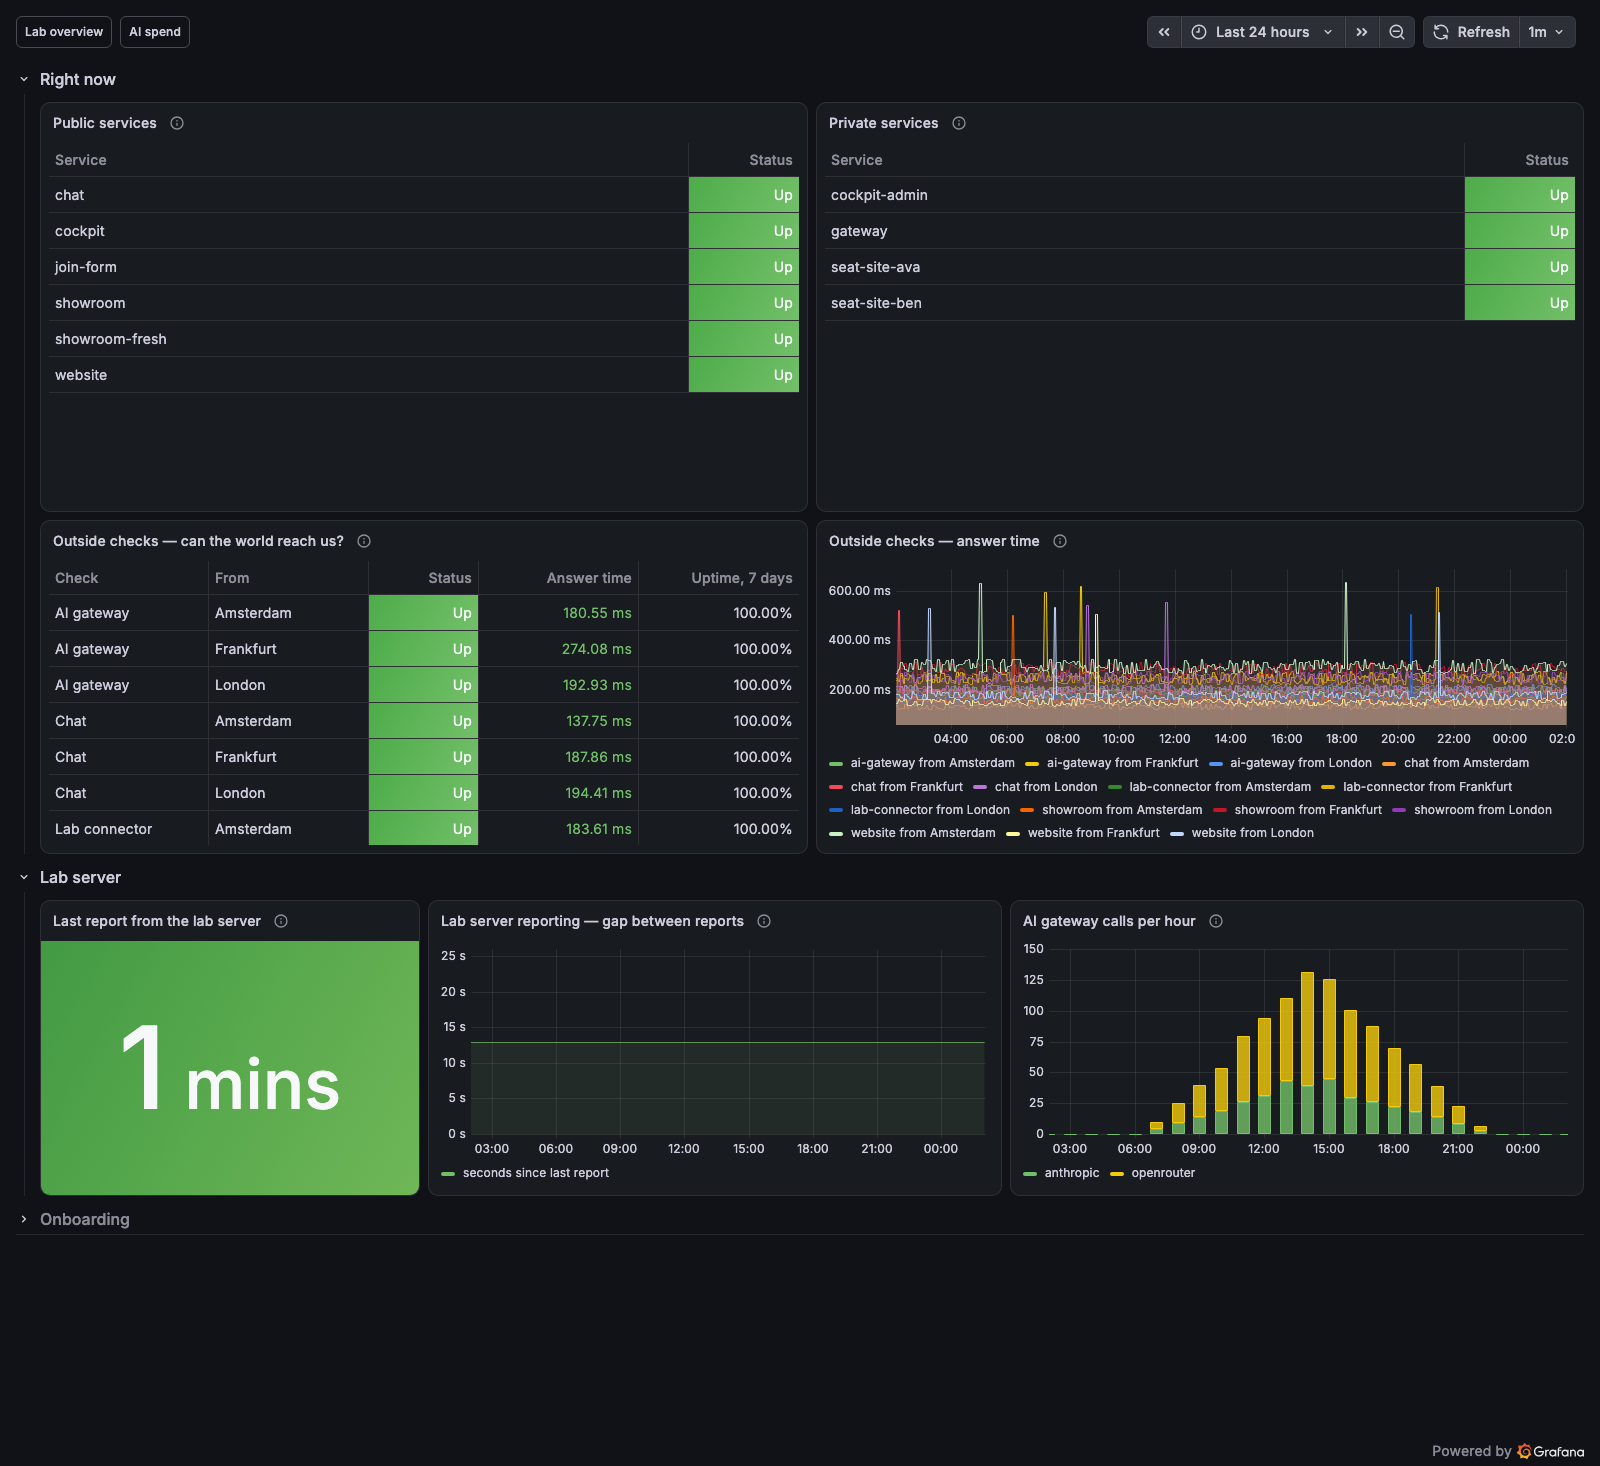
Behind a login, three additional dashboards show admins what needs attention, where AI spend goes, and what is down. Their screenshots below use invented people and numbers.
The work behind it
- Lines written
- 16,077
- Files
- 30
- Days worked
- 18
- Commits
- 68
- Started
- 9 Oct 2026
- Last change
- 19 Nov 2026
What it would have cost
$15,000to have this built for you (its answers ranged $10,000–$17,000)
$2,500what it is worth to own today
Mostly Grafana JSON config tied to private metrics; some placeholder corruption; low standalone resale value.
Priced on 12 Nov 2026 by an AI model that read the project's source code: the middle of 3 answers. How this is worked out.
All projects in the showroom · Ask for a seat
Measured 22 Nov 2026.